Myths and fabrications
By JC | May 1, 2012
Tomorrow I get to give a presentation to the Seattle Knitters Guild, and I’m really looking forward to it – but that’s a recent development.
For months, I had been dreading the event. The idea of public speaking didn’t bother me – after all, I teach for a living — but the possibility that I didn’t have anything to say gave me the heebie-jeebies. I mean, in a classroom, I can talk for a bit, and let students knit for a bit, and repeat the process until the time’s up. But how was I to fill an hour by just talking? Without telling people what to do?
It was a silly fear, really. With charts as the topic, I have plenty to say. All I needed to do was figure out how to focus the presentation.
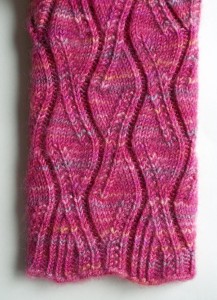
And finally I hit on it: Explain why I’m a chart fanatic and why charts are so cool by showing how I make use of charts in my design work. How the main stitch pattern in the Ogee shawl evolved from a very different pattern. How Molly’s stitch patterns are related, and how the V-neck was planned. How the ribbing on the Sidewinder socks came to be. That sort of thing.
But before getting all lovey-dovey over charts, I figure it might be best to dispell a few chart myths. You know, in case anyone in the audience isn’t as into charts as I am. Busting these myths wide open ought to do the trick, don’t you think?
- Myth #1: Charts are hard.
- Myth #2: Row 1 is always a right-side row.
- Myth #3: Charts would be better if the symbols just said what to do.
- Myth #4: Somebody really ought to come up with a standard set of symbols.
- Myth #5: “No stitch” symbols are evil.
Ooh, it’s hard to tell which will be the most fun to debunk.
If you live in the Seattle area, c’mon down and attend the guild meeting! As a bonus, Acorn Street Shop will be there, selling copies of Charts Made Simple. Don’t forget that I’m teaching Slick Set-in Sleeves and Charts Made Simple on Saturday – contact Acorn Street if you’re interested.


2 Comments