

A little surreal
By JC | March 24, 2015
You know how I’ve said that I drew stitch maps by hand, long before developing Stitch-Maps.com? Well, I found a little proof today. And it was a little surreal.
While cleaning out some dusty corners of my laptop’s hard drive (because, you know, I was stalling on more important tasks), I came across some notes I wrote to myself in 2005, after attempting to draw a stitch map for Oak Leaves and Acorns. It’s a gloriously intricate stitch pattern whose dense written instructions take up an entire page in Knitting Counterpanes by Mary Walker Phillips, but for which I’d never seen a chart of any sort. And I wanted to see a chart.
I wish I could show you the stitch map I drew then. No doubt that scrap of paper has long since been lost in my… ah, how shall we phrase it?… idiosyncratic filing system. But I do have those notes. And, almost ten years on, they’re kind of spooky in their predictions. Here they are, lightly paraphrased:
Notes to self, July 11, 2005
Tidbits learned while creating free-form charts for Oak Leaves and Acorns:
- Drawing is a pain. On the first go, you have to guess at the spacing for the stitches. And you have to count and re-count stitches to make sure you’re on track.
- Re-drawing is a pain: tedious, error-prone, still requires a fair amount of counting and futzing. But it leaves a better-looking chart. And it really helps you understand the pattern.
- Following is a pain, if you want to count stitches (say, on WS rows) to verify that you’re on track. But if you want to use landmarks, free-form charts are the best.
- Regardless, free-form charts are still the greatest thing since sliced bread for charts where the stitch count varies: you can see what bulges and where. They’re also great for patterns where the yarn overs and decreases aren’t adjacent: you can see what leans left and what leans right.
- For patterns like Oak Leaves and Acorns, where the various chunks flow into one another (for example, the acorns don’t line up vertically; instead, the acorns and leaves flow into the central stem), regular gridded charts are a serious problem. You can show the central stem, and you can show each individual chunk, but you can’t show the flow from the chunks into the central stem.
- Though you’d want the rows of a free-form chart to bend as the knitted rows would bend, this makes it difficult to follow the chart by covering the as-yet-unknit rows.
How do these observations impact plans for free-form charting software?
- Software that does the drawing/re-drawing, positioning, and some of the counting would make the job way faster and easier. (Would it lessen one’s ability to “learn” a pattern via charting? Maybe, maybe not: maybe, by making it easier to “play” and ask “what if?” questions, the software would increase one’s ability to get familiar with a pattern and its variations.)
- It may not always be possible to create a good gridded chart from a free-form chart, even with user assistance.
- It might be interesting to develop software with the ability to draw completely free-form charts (that is, charts whose rows bend and sway) or semi-constrained charts (whose rows only run in straight horizontal lines).
Bizarre, huh?
Of course, in keeping with the ought-to-be-doing-something-else theme, I had to map Oak Leaves and Acorns today.
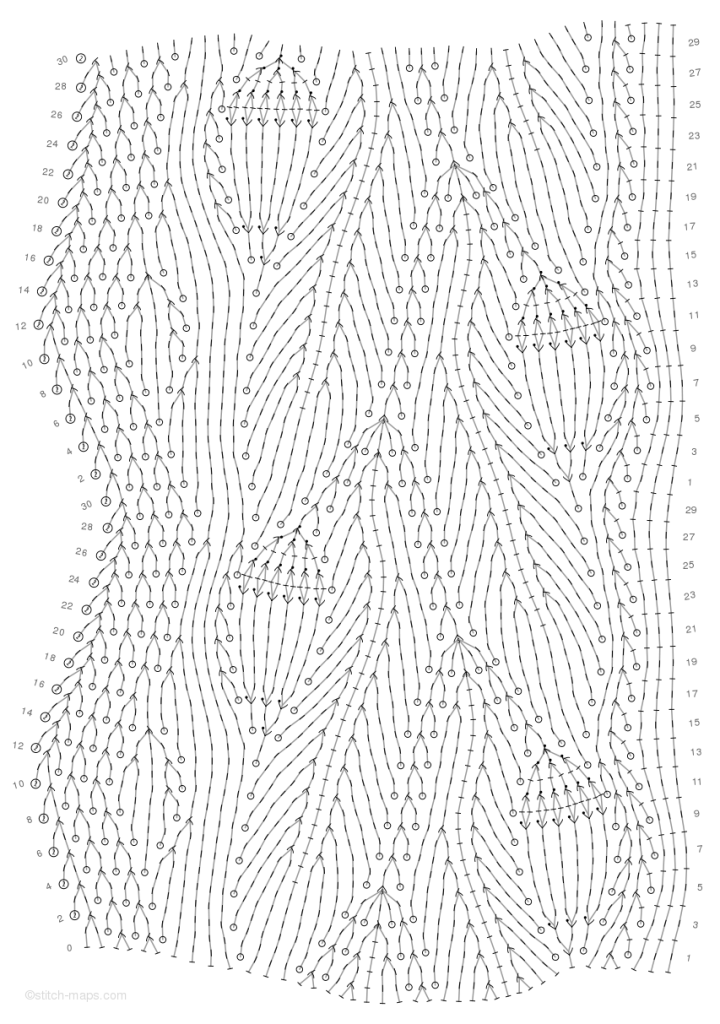
Is that not the coolest thing? And while the long-lost, ugly, hand-drawn stitch map probably took hours to complete, this one only took minutes. Yay for technology!
Comments are closed.